

LLM observability is the instrumentation and evaluation layer that lets you detect hallucinations, attribute cost per call, and root-cause failures across multi-step agent workflows in production. It goes beyond uptime and latency checks. The core mechanism is session-level tracing paired with evaluation scores treated as first-class telemetry, not an afterthought run in a notebook after something breaks.
TL;DR:
- Session-level tracing and linking evaluation scores are essential for diagnosing failures in multi-step LLM workflows, as a single API call does not reveal root causes.
- Monitoring should include latency, token counts, cost ratios, output factuality, hallucination rates, and safety signals such as toxicity and PII detection, to prevent blind spots.
- Complete visibility requires capturing prompts, retrieved data, tool payloads, memory operations, and attaching evaluation scores to specific session spans for accurate root-cause analysis.
- Cost monitoring depends on logging tokens, model IDs, and managing token caps, caching, and routing tasks to lower-cost models to prevent runaway expenses.
- Implementing open standards like OpenTelemetry and starting with session-level traces facilitate future vendor flexibility and reduce long-term migration pain.
Table of Contents
- What Is LLM Observability, and How Does It Differ From Traditional APM?
- What Metrics Should You Track for LLM Performance?
- How Do You Get Full Visibility Into Agentic Workflows?
- What's the Best Way to Evaluate LLM Outputs at Scale?
- How Do You Detect Drift in Prompts, Inputs, and Retrieval Data?
- What Does Cost Monitoring Actually Require?
- What Security and Safety Signals Belong in Your Observability Stack?
- How Should You Instrument Your LLM Stack?
- How Do You Implement LLM Observability in Six Steps?
- Mindpod's Operational Perspective and Common Tradeoffs
- Get Help Building an Observability Stack That Fits Your Budget
- Primary Sources and Implementation References
- Sources
- FAQ
What Is LLM Observability, and How Does It Differ From Traditional APM?
Traditional application performance monitoring answers a narrow question: is the service up, and how fast is it responding? That works fine for deterministic code, where the same input reliably produces the same output. LLMs break that assumption completely. Ask the same model the same question twice and you can get two different answers, two different token counts, and two different costs. A stack trace tells you nothing about why a model hallucinated a customer's account balance or looped forever inside an agent chain.
That's the practical reason session-level tracing and linking evaluation scores to traces is essential for diagnosing whether a failure came from the prompt, the retrieval step, or the orchestration logic. You need to see the whole conversation, not just a snapshot of one API call.
Most mature setups organize signals around the MELT model: metrics, events, logs, and traces. Applied to LLM systems, that breaks down into:
- Metrics — latency, token counts, cost per call, error rates, and quality scores tracked over time.
- Events — discrete occurrences like a guardrail block, a retry, or a fallback to a cheaper model.
- Logs — the raw prompt, completion, retrieved context, and tool outputs for a given call.
- Traces — the full sequence connecting every step of a multi-turn or multi-agent session into one reconstructable timeline.
The reconstruction part matters most. When an agent workflow calls a retriever, then a tool, then a reasoning model, then another tool, a trace has to stitch all of that into a single session graph. Without it, debugging a bad output means guessing which of five steps went wrong, which is how teams end up shipping patches that fix nothing.
What Metrics Should You Track for LLM Performance?
Every team monitoring an LLM in production needs four categories of signals, and skipping any one of them creates a blind spot that eventually costs money or trust.
Performance metrics cover the basics APM already does well: latency (both time-to-first-token and total completion time), throughput under load, and error rate from timeouts or malformed responses. These matter because LLM latency is far less predictable than typical API latency; a 200-token response and a 2,000-token response from the same endpoint can differ by seconds.
Cost metrics track tokens in, tokens out, and dollars per call. This is where a single high-value alert pays for itself:
One of the highest-leverage operational signals is the P99/P50 cost ratio: if your 99th percentile per-call cost runs more than 50 times your median, something is generating runaway token usage on specific requests, usually unconstrained
max_tokensor an unbounded retrieval loop.
Quality metrics measure whether the output is actually good, not just fast and cheap. That means groundedness (does the answer match the retrieved source material), factuality, and a measurable hallucination rate. One practical technique computes semantic similarity between the prompt and response using embeddings to flag responses that drift from the source context, feeding the result into a monitoring pipeline as a standard metric.
Safety signals round out the list: toxicity scores, PII detection hits, and prompt injection attempts. These need to be tracked as counters and alerted on, not just logged for later review.
Here's the shortlist to wire up first:
- Latency (p50, p95, p99) and error rate by endpoint
- Token counts and cost per call, plus the P99/P50 cost ratio
- Groundedness or factuality score per response
- Hallucination rate against a labeled or synthetic benchmark
- Toxicity, PII, and prompt-injection detection counts
How Do You Get Full Visibility Into Agentic Workflows?
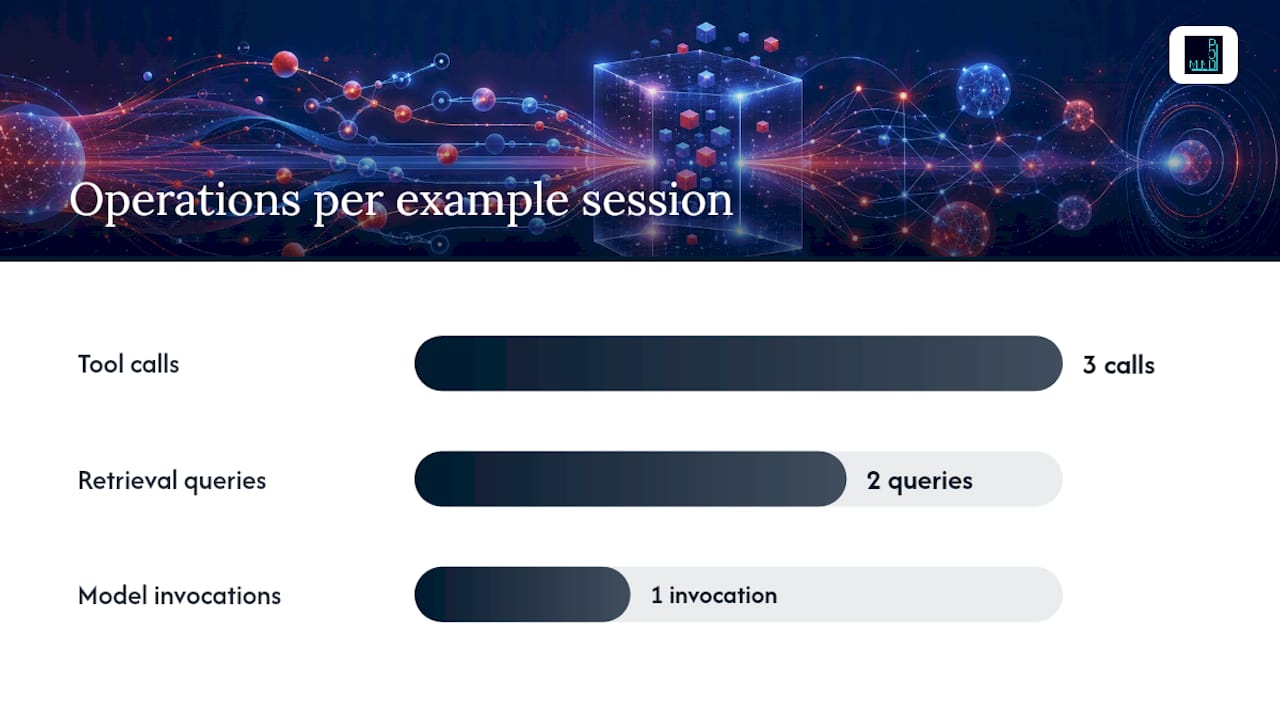
A call-level span tells you that one model invocation took 800 milliseconds and cost $0.02. It tells you nothing about whether the agent that made three tool calls and two retrieval queries before that invocation was actually reasoning correctly. Agentic systems need session-level traces that capture the entire execution graph, not isolated spans stitched together after the fact.
A properly instrumented trace should capture, at minimum:
- The full prompt sent to the model, including system instructions and injected context.
- Retrieved chunks, their source IDs, and their relevance scores.
- Every tool call's arguments and the raw payload it returned.
- Token counts (input, output, total) and the specific model ID used for that step.
- Any memory reads or writes if the agent maintains state across turns.
This level of detail is what makes root-cause analysis deterministic instead of a guessing exercise; you can instrument the full execution graph by capturing retrieval context, tool-call arguments, and memory operations, then linking evaluation scores directly to each span.
That last part, attaching evaluation scores to specific spans rather than the session as a whole, is what separates useful observability from a glorified log viewer. If a groundedness score drops on the retrieval span but stays fine on the generation span, you know the retriever pulled bad context, not that the model reasoned poorly. Without that granularity, every failure looks the same from the outside: a bad final answer with no clue where things went sideways.
Pro Tip: Tag every span with a session ID and a step index before you ship anything to production. Retrofitting trace IDs onto an agent that's already live is far more painful than adding two lines of instrumentation code up front.
What's the Best Way to Evaluate LLM Outputs at Scale?
There's no single right answer here, mostly because inline evaluation and batch evaluation solve different problems, and most teams need both running at once.
Inline evaluation happens synchronously, in the request path, before a response reaches the user. It's how you block a response that fails a safety check or triggers a hallucination flag. The tradeoff is latency: running a GPT-4-class model as a judge inside the request path can add hundreds of milliseconds and real cost per call. Research on inline evaluation shows that purpose-built small models can perform multiple checks in under 200 milliseconds, cutting both latency and cost compared to a synchronous large-model judge.
Async and batch evaluation run against golden datasets, usually as part of a CI pipeline before a prompt or model change ships. This is where regression testing lives: run last week's known-good queries against today's model version and flag any quality drop before it reaches customers.
Human review still has a place, and it should be triggered by thresholds, not vibes:
- Any response flagged by an automated judge below a set confidence score
- Any request touching regulated or high-stakes content (medical, legal, financial)
- A sampled percentage of all traffic, reviewed on a rolling basis regardless of flags
Mindpod's own field guidance on human-in-the-loop AI frames this as an escalation ladder rather than a blanket policy: low-risk outputs get automated checks only, medium-risk outputs get sampled review, and high-risk outputs get a human in the loop before anything ships.
Pro Tip: Start your golden dataset small. Twenty to thirty real production queries with known-good answers catch more regressions than a bloated 500-query set nobody maintains.
How Do You Detect Drift in Prompts, Inputs, and Retrieval Data?
Drift is the silent killer of LLM systems. Nothing crashes, no error rate spikes, but output quality slowly degrades because the world the model is operating in has changed underneath it. Three types of drift matter, and each needs a different detector.
- Input-distribution drift happens when the questions users ask shift over time. Track this with embedding-centroid drift detection: compute the centroid of incoming query embeddings on a rolling window and alert when it moves meaningfully from your baseline. Research on failure modes in production ML systems identifies input drift, template drift, and retrieval drift as distinct problems requiring separate baselines and detectors.
- Prompt-template drift happens when someone edits a system prompt in a config file and nobody notices the downstream effect. Hash every prompt template on deploy and diff it against the previous version; any unreviewed change should trigger an alert, not a silent rollout.
- Retrieval-corpus drift happens when your knowledge base changes, gets stale, or gets contaminated with bad documents. Track Precision@k and Recall@k against a fixed evaluation set on a regular cadence, and rebaseline whenever the corpus changes materially.
A related but often-overlooked technique is behavioral fingerprinting: running periodic probes that measure refusal style, tone, and policy adherence turns vague "the model feels different lately" complaints into an alertable metric you can actually act on.
What Does Cost Monitoring Actually Require?
Cost is the metric most teams bolt on last and regret not tracking from day one. Every single call should log five data points: input tokens, output tokens, total tokens, the specific model ID, and the resulting cost in dollars. Skip the model ID and you can't tell whether a cost spike came from traffic growth or from someone quietly switching an endpoint to a more expensive model.
The single highest-value alert in this category is the P99/P50 cost ratio referenced earlier. A healthy system keeps that ratio tight; a ratio blowing past 50x usually means a handful of requests are consuming disproportionate tokens, often from unconstrained max_tokens settings or a retrieval step pulling far more context than necessary.
Once you can see the problem, three controls handle most of it:
- Cap
max_tokensper endpoint based on actual use-case needs, not a generous default. - Cache aggressively for repeated or near-duplicate queries, especially in high-traffic customer-facing flows.
- Route by complexity, sending simple classification or extraction tasks to smaller, cheaper models and reserving frontier models for reasoning-heavy steps.
None of this is exotic engineering. It's the same discipline teams already apply to cloud spend, just pointed at a new line item that can grow fast if nobody's watching it.
What Security and Safety Signals Belong in Your Observability Stack?
LLM-specific risks don't show up in a traditional security dashboard, which is exactly why they get missed until something goes wrong publicly.
Prompt injection is the most distinctive new threat. Watch for anomalous patterns in incoming prompts, unusual instruction-like phrasing embedded in user input or retrieved documents, and sudden shifts in the ratio of system-instruction language to normal conversational text. Flagging these patterns at ingestion, before they ever reach the model, is far cheaper than cleaning up after a successful injection.
PII exposure is the second major risk; scanning inputs and outputs for personal data aligns well with a privacy-first approach to analytics that protects sensitive information at ingestion time. Scan both inputs and outputs for personal data at ingestion time, not after the fact, and log redaction events as their own metric so you can track how often it's happening and where.
Guardrail actions need to be observable events in their own right:
- Block — reject the request entirely and log the reason.
- Transform — redact or rewrite the offending content and pass a cleaned version through.
- Escalate — route to human review when confidence in an automated decision is low.
Mindpod's AI governance framework treats these three actions as the backbone of any compliance-facing deployment, because regulators and auditors want to see that a decision was made and logged, not that the system silently let something through.
How Should You Instrument Your LLM Stack?
The instrumentation layer you choose today determines how much pain you feel in eighteen months when you want to switch vendors or add a new backend. This is where open standards earn their keep.
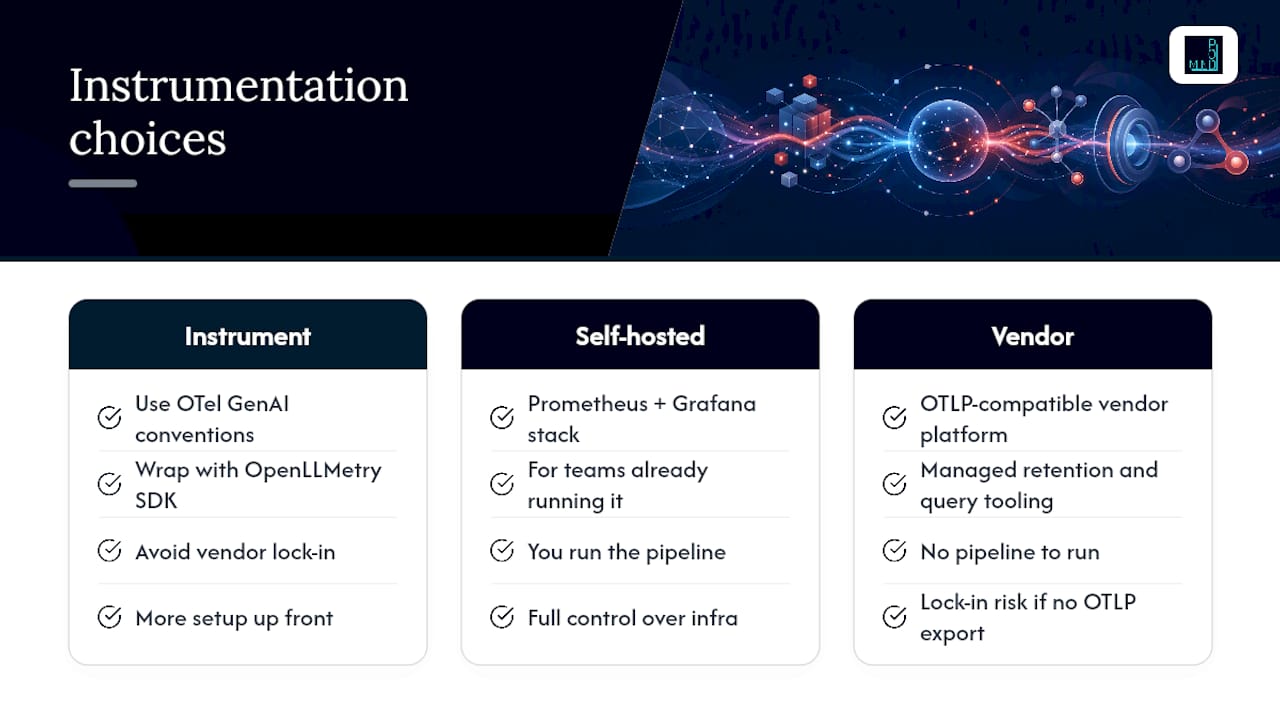
OpenTelemetry has published GenAI semantic conventions specifically for LLM applications, covering attributes like model name, temperature, prompt and completion content, and token counts, all exportable to standard backends like Prometheus and Grafana or Jaeger. Building on those conventions rather than a proprietary schema is the single best decision you can make early, because it means your traces aren't locked to one vendor's dashboard.
OpenLLMetry, built by Traceloop, is the most widely adopted open-source SDK for this exact job. It wraps OTel's conventions with LLM-specific instrumentation and ships integrations for common backends out of the box, so you get session-level traces without writing custom exporters from scratch.
For the backend itself, most teams land in one of two camps: a self-hosted Prometheus and Grafana stack for teams that already run that infrastructure for other services, or an OTLP-compatible vendor platform for teams that want managed retention and query tooling without running the pipeline themselves.
The tradeoff to watch is lock-in. A vendor SDK with proprietary attributes might get you to a working dashboard faster, but migrating away from that vendor later means re-instrumenting your entire codebase. Starting with OTel conventions costs a little more setup time up front and saves a rewrite later.
Pro Tip: If you're evaluating a vendor, ask them one question first: can I export my traces as standard OTLP if I leave? If the answer is no or it's complicated, that's a lock-in risk worth pricing into the decision.
How Do You Implement LLM Observability in Six Steps?
Going from zero visibility to a working observability stack doesn't require months of planning. It requires sequencing the work correctly so each step builds on the last.
- Define KPIs mapped to business SLAs. Don't start with "monitor everything." Start with the two or three metrics that actually map to a business outcome, like response accuracy for a customer support bot or cost-per-resolved-ticket for an agent.
- Instrument traces and cost signals first. Wire up session-level tracing with OpenTelemetry or OpenLLMetry before you build a single dashboard. You can't monitor what you can't see.
- Baseline golden queries and deploy drift monitors. Run a fixed set of known queries through the system, capture the results as your baseline, and stand up embedding-centroid drift detection against it.
- Add inline evals and CI evals together. Inline checks catch problems before they reach users; CI evals catch regressions before a change ships.
- Create alerts and runbooks, not just dashboards. A dashboard nobody watches at 2 a.m. doesn't stop an incident. Pair every critical metric with an alert threshold and a documented response, similar to the structure in Mindpod's AI incident response framework.
- Establish human-in-the-loop escalation. Decide, in advance, which categories of failure get routed to a human reviewer and how fast that review has to happen.
Mindpod's Operational Perspective and Common Tradeoffs
The most common mistake teams make isn't skipping observability entirely, it's instrumenting only the model call and stopping there. That gets you latency and token counts, and it tells you nothing about whether the retrieval step or the tool-calling logic caused a bad answer. Full session tracing costs more setup effort than a single API wrapper, and it's the difference between debugging with evidence and debugging by guessing.
The second mistake is picking a vendor's proprietary SDK before evaluating what happens when you outgrow it. Building on OpenTelemetry costs a bit more time upfront and pays that back the first time you need to switch backends without a rewrite.
Human checkpoints belong in the design from day one, not as a bolt-on after a bad output makes it to a customer. Deciding whether to build this in-house or bring in advisory support usually comes down to one question: does your team have someone who's shipped agentic systems to production before, or would that be a first for everyone involved?
— jaras
Get Help Building an Observability Stack That Fits Your Budget
Standing up session-level tracing, drift detection, and evaluation pipelines from scratch is a real engineering lift, and most SMB teams don't have a spare quarter to burn getting it right on the first try. Mindpodtech closes that gap through fractional technology leadership and agentic AI strategy and governance, applying the same OpenTelemetry-based instrumentation and human-in-the-loop checkpoints covered above to whatever stack you're already running, without locking you into a proprietary dashboard.
If cloud spend is part of the concern, cloud architecture and cost optimization work is folded into the same engagement, so the P99/P50 cost controls above get tied directly to your infrastructure bill rather than living in a separate silo. Every engagement starts with a free technology assessment that produces a prioritized, plain-language plan you own outright, whether or not you continue with Mindpodtech afterward. For teams running Microsoft or Azure environments, the MITB platform extends that same observability discipline into day-to-day autonomous IT operations. Book a free assessment to see where your current setup has blind spots.
Primary Sources and Implementation References
For teams building this stack directly, a handful of primary sources are worth bookmarking. OpenTelemetry's LLM observability blog post covers concrete attribute recommendations and backend routing. Traceloop's OpenLLMetry documentation walks through SDK setup and semantic conventions in detail. AWS's monitoring techniques for large language models post details a modular metric-compute architecture using embeddings for grounding checks, and Datadog's LLM observability knowledge base is a solid reference for session-tracing terminology. For the research behind small-model inline evaluation tradeoffs, see arXiv:2411.05285.
Sources
- What Is LLM Observability & Monitoring? | Datadog
- Techniques and approaches for monitoring large language models on AWS
- arXiv:2411.05285
FAQ
What Is LLM Observability?
LLM observability is the combination of tracing, metrics, and evaluation scoring that lets teams detect hallucinations, track cost per call, and root-cause failures in production LLM and agent systems.
How Is LLM Observability Different From Monitoring?
Monitoring tells you a system is up and how fast it's responding; observability lets you reconstruct why a specific output was wrong by tracing the full session, including retrieval, tool calls, and evaluation scores.
What Metrics Matter Most for LLM Performance?
Latency, cost per call and the P99/P50 cost ratio, groundedness or factuality scores, hallucination rate, and safety signals like toxicity and PII detection counts are the core metrics every team should track.
Should I Use OpenTelemetry or a Vendor SDK for LLM Tracing?
OpenTelemetry with GenAI semantic conventions, often implemented through OpenLLMetry, offers portability across backends and avoids the lock-in risk of a proprietary vendor schema.
Can Mindpodtech Help Implement LLM Observability?
Mindpodtech provides fractional technology leadership and agentic AI strategy services that build session-level tracing, evaluation pipelines, and human-in-the-loop checkpoints into an existing stack, starting with a free technology assessment.