

AI agent monitoring means instrumenting the decision-making layer of your autonomous agents — capturing not just uptime and error rates, but every tool call, reasoning step, token consumed, and retrieval made — so you can explain why an agent behaved a certain way, not just that it failed. IBM's observability research frames this precisely: agent observability collects MELT signals plus AI-specific telemetry to make execution inspectable.
Start here: Enable end-to-end distributed tracing on every agent run. Sample a slice of production traffic immediately. Add at least one automated evaluator — even a simple rubric check — within the first two weeks. Those three steps give you more signal than months of log-watching.
The telemetry categories to instrument first:
- LLM calls: model ID, prompt version, tokens in/out, latency to first token, finish reason
- Tool calls: tool name, arguments, return value, call duration, success/failure
- Retrieval operations: query text, retrieved document IDs, relevance scores, latency
- Token usage and cost: cumulative tokens per run, cost per span, cost per user session
Key Takeaways
Effective AI agent monitoring requires structured traces, automated evaluation, and a continuous improvement loop — not just logs and uptime dashboards.
| Point | Details |
|---|---|
| Instrument the decision layer first | Capture LLM calls, tool calls, retrievals, and token usage per span before anything else. |
| Version prompts before going live | Without prompt versioning, you cannot isolate whether a quality regression came from a model change or a prompt edit. |
| Combine LLM-as-judge with code checks | Use LLM-as-judge for nuanced quality; use code-based checks for objective criteria — both are needed. |
| Detect multi-agent failures by traffic shape | Silent loops and subagent explosions only appear in run depth and token distribution, not individual span errors. |
| Mindpodtech assessment as first step | Mindpodtech's free technology assessment maps instrumentation gaps and delivers a prioritized plan within one week. |
Table of Contents
- What does AI agent observability actually cover?
- What signals and metrics must you collect?
- How do you instrument agents in production without breaking things?
- What features matter most in an agent monitoring platform?
- Build vs. buy: how do you make the right call?
- How do you monitor multi-agent workflows and catch silent failures?
- How do you control cost through token accounting and sampling?
- How Mindpod approaches agent monitoring rollout
- What teams consistently get wrong about agent observability
- Mindpodtech's assessment offer for teams ready to instrument
- Sources
- FAQ
What does AI agent observability actually cover?
Traditional monitoring asks "is the service up?" Agent observability asks "did the agent make the right decision, and can I prove it?" That distinction matters operationally because an agent can return HTTP 200 while hallucinating, looping, or burning through your token budget on a dead-end reasoning path.
Monitoring vs. observability in the agent context:
Monitoring covers alerts, SLA thresholds, and uptime dashboards. It tells you something broke. Observability is the instrumentation that lets you reconstruct what happened inside the agent's decision loop — which tool it chose, what context it retrieved, which prompt version was active, and how the model responded at each step. You need both, but observability is what makes debugging tractable.
AI-specific telemetry that has no equivalent in traditional service monitoring:
- Prompt version and template hash (so you can correlate behavior changes to prompt edits)
- Token counts per span, not just per request
- Tool selection rationale (which tools were considered, which were called, in what order)
- Retrieval context (what documents or chunks the agent actually saw)
- Decision logs and intermediate reasoning steps
- Model drift indicators (output distribution shifts against a baseline eval set)
The bottom row is the real gap. Traditional observability has no evaluation layer. Agent observability requires one, because "did it work?" for an LLM-based system is a quality judgment, not a binary status code.
What signals and metrics must you collect?
Hugging Face's agents course organizes agent signals into three categories: latency, cost, and quality. That's the right frame. Here's what each means in practice.
Latency signals:
- End-to-end latency: wall-clock time from user request to final response
- Per-step span latency: time for each LLM call, tool call, or retrieval operation individually
- Time-to-first-token (TTFT): how long before the model starts streaming output — critical for user-facing agents
Cost and token signals:
- Tokens in / tokens out per span: measure separately; output tokens cost more on most providers
- Cost per run: multiply token counts by the model's per-token rate and sum across spans
- Cost per customer cohort: aggregate run costs by user segment to find who's driving spend
Quality and evaluation signals:
- Accuracy against ground truth: for agents with verifiable outputs (code, structured data, lookups)
- Hallucination detection: automated checks that flag responses unsupported by retrieved context
- Drift: eval score degradation over time against a fixed benchmark set
- User feedback: thumbs up/down, correction events, escalations to human review
Error and failure signals:
- Tool call failure rate: percentage of tool invocations that return errors or timeouts
- Retry count per run: high retry counts signal stuck tool calls or unstable APIs
- Context window utilization: how close each call gets to the model's token limit
Minimal trace schema
Every span in your trace should capture these fields. StackAI's observability guide recommends structured traces that record prompt versions, tool calls, retrieval context, and model outputs as the baseline for localizing failures.
| Field | Type | Notes |
|---|---|---|
trace_id | string | Unique per agent run |
span_id | string | Unique per step within a run |
parent_span_id | string | Links steps into a tree |
prompt_version | string | Hash or semantic version of the prompt template |
model_id | string | Provider + model name (e.g., openai/gpt-4o) |
tokens_in | integer | Input tokens for this span |
tokens_out | integer | Output tokens for this span |
tool_name | string | Name of tool called (null if LLM-only span) |
tool_args | JSON | Arguments passed to the tool |
retrieval_ids | array | IDs of retrieved documents or chunks |
latency_ms | integer | Span duration in milliseconds |
eval_score | float | Automated evaluator score (0–1), if run |
timestamp_start | ISO 8601 | Span start time |
error | string | Error message if the span failed |
How do you instrument agents in production without breaking things?
The architecture has four layers. Get the layers right and you can swap out storage backends or evaluation tools later without re-instrumenting your agents.
- Capture layer: SDK hooks or middleware that emit spans and events from your agent code. This is where OpenTelemetry lives. Keep this layer thin — it should add less than 5ms of overhead per span.
- Pipeline layer: A collector or broker (OpenTelemetry Collector, a message queue) that receives raw telemetry, applies sampling, redacts sensitive fields, and routes data to storage.
- Storage and processing layer: A time-series database for metrics, a trace backend for spans, and a log store for events. Many teams use a single observability platform that handles all three.
- Evaluation and alerting layer: Automated evaluators run against sampled traces, eval scores feed dashboards and alert rules, and regression tests run on every deployment.
OpenTelemetry's semantic conventions for Generative AI are the practical standard for the capture layer. Adopting them early prevents data fragmentation as your agent frameworks and model providers evolve. The conventions define standard attribute names for LLM calls (gen_ai.request.model, gen_ai.usage.input_tokens, etc.) so your traces stay interoperable across providers.
Instrumentation checklist:
- Assign a
trace_idat the entry point of every agent run and propagate it through all subagents and tool calls - Version every prompt template before deploying; store the version hash in each span
- Redact PII and secrets at the pipeline layer, not the application layer — redacting in code is fragile
- Set retention rules: keep high-value traces (failures, low eval scores, flagged runs) for 90 days; routine passing traces for 14–30 days
- Add correlation IDs that link agent traces to your existing application traces and user session IDs
Sampling strategy:
Don't trace everything forever.
Pro Tip: Version your prompts before you instrument anything else. Without prompt versioning, you cannot tell whether a quality regression came from a model update, a prompt change, or a data shift. One hour of setup here saves days of debugging later.
What features matter most in an agent monitoring platform?
Whether you're evaluating a commercial platform or scoping an in-house build, these are the capabilities that directly affect production reliability and debuggability. Not all of them are equally urgent.
Mission-critical for any team:
- Structured trace capture with parent/child span relationships that reconstruct the full decision tree
- Prompt version linking so every trace points to the exact template that produced it
- Automated evaluators (LLM-as-judge and code-based checks) that run on sampled production traffic
- Token and cost analytics broken down by span, run, and user cohort
- Alerting on quality signals (eval score drops, hallucination rate spikes) not just latency and errors
- RBAC and audit logs for compliance and team access control
Important but not day-one blockers:
- Real-time prevention hooks that can stop a run mid-flight when a policy threshold is crossed
- A/B eval support for comparing prompt versions or model upgrades against a baseline
- Native integrations with your agent framework (LangChain, LlamaIndex, custom) to reduce instrumentation boilerplate
Questions to ask any vendor before signing:
- Does your platform support OpenTelemetry ingestion natively, or do I need a proprietary SDK?
- Can I export raw traces in a standard format (JSON, Parquet) without a support ticket?
- What's the retention policy, and what does it cost to extend it?
- How does eval automation work — do I write the rubrics, or is it black-box scoring?
- What's the data residency model, and can traces stay within my cloud region?
For SMBs specifically: skip platforms that require dedicated infrastructure teams to operate. If the platform's own observability is opaque, that's a red flag — you should be able to see your ingestion pipeline's health the same way you see your agents'.
Build vs. buy: how do you make the right call?
This is the decision most teams get wrong by defaulting to "build" because they want control, or "buy" because they want speed, without pricing out the actual tradeoffs.
| Dimension | Build in-house | Buy / managed platform |
|---|---|---|
| Time to first trace | 4 weeks | 1–3 days |
| Ongoing maintenance | High (your team owns it) | Low (vendor owns infrastructure) |
| Customization | Full control | Limited to vendor's extension points |
| Data residency | Full control | Depends on vendor; verify before signing |
| Vendor lock-in | None | Medium to high (proprietary trace formats) |
| Eval automation | Must build from scratch | Usually included; quality varies |
| Total cost (year 1) | Engineering time + infra | License + integration time |
The honest answer for most SMBs: buy a platform for the first 12 months, but instrument with OpenTelemetry from day one so you can migrate later without re-instrumenting. The lock-in risk is in the trace format and the eval tooling, not the SDK.
Vendor red flags to walk away from:
- Opaque sampling policies (you can't see or control what percentage of traces are retained)
- No prompt version linking in the trace schema
- Eval automation that's a black box with no rubric export
- No raw trace export capability
- Inability to ingest OpenTelemetry-formatted data
Numbered vendor evaluation process:
- Run a two-week proof of concept with real production traffic, not synthetic data
- Deliberately trigger a known failure and verify the platform surfaces it in under five minutes
- Export a week of raw traces and confirm the format is usable outside the platform
- Check the eval automation against a set of known-bad outputs you've already labeled
- Price out the cost at 3x your current trace volume — agents scale fast
LangChain's observability guide makes the case for feeding production traces into evaluation datasets and regression tests as the core of a continuous improvement loop. That loop is only possible if your platform lets you export traces and run evals programmatically. If it doesn't, you're locked into the vendor's eval tooling forever.
How do you monitor multi-agent workflows and catch silent failures?
Single-agent monitoring is tractable. Multi-agent systems introduce failure modes that don't show up in individual spans — they only appear in the shape of traffic across the whole workflow.
Silent failure classes to watch for:
- Silent loops: an agent calls itself or a subagent repeatedly without making progress; individual spans look healthy, but run count and cost spike
- Subagent explosions: a planning agent spawns more subagents than intended; token spend multiplies without a corresponding increase in useful output
- Stuck tool calls: a tool returns a partial result and the agent retries indefinitely rather than failing gracefully
- Retry storms: a transient API error triggers cascading retries across multiple agents simultaneously
- Context-window cliff: accumulated context pushes a call close to the model's token limit, causing truncation or refusal that the agent doesn't handle
- Groundless responses: the agent produces a confident answer not supported by any retrieved document — detectable only with a retrieval-grounding evaluator
- Deadlocks: two agents wait on each other's output; the workflow stalls without any individual span erroring
Detection patterns:
Shape-of-traffic analysis catches what span-level monitoring misses. Track run depth (how many spans per trace), total tokens per trace, and wall-clock run duration as distributions. Anomalies in those distributions surface loops and explosions before your cost alert fires.

For groundless responses, run a retrieval-grounding evaluator on every sampled trace: does the response cite claims that appear in the retrieved context? A drop in that score is an early hallucination signal.
Remediation patterns:
- Circuit breakers on tool call counts per run (e.g., stop a run that exceeds 20 tool calls)
- Stop-run hooks that fire when a quality evaluator score drops below a threshold mid-execution
- Exponential backoff with jitter on all external API calls, with a hard retry cap
- Context window budget enforcement: reserve a fixed token buffer for the model's response and truncate retrieved context before it crowds out the answer
- Automated rollback triggered when a new prompt version's eval scores fall below the previous version's baseline
LangChain's production observability guidance notes that at scale, teams need sampling strategies and automated pattern detection to keep investigations tractable — because individual spans often look fine while the aggregate workflow is failing.
For AI agent governance at the endpoint level, circuit breakers and stop-run hooks are the enforcement mechanism that turns a policy into a runtime control, not just a document.
How do you control cost through token accounting and sampling?
Token spend is the most common surprise in production agent deployments. The cost doesn't come from a single expensive call — it comes from accumulated context, retry loops, and subagent fan-out that nobody priced out during development.
Cost accounting by span:
Track tokens in and tokens out separately for every span. Aggregate cost per run, then roll it up by user cohort, feature, and agent type to find where spend concentrates.
Common cost spike causes:
- Prompt templates that include full conversation history without truncation
- Retrieval pipelines that return too many chunks, inflating context on every call
- Retry loops that re-send the full context on each attempt
- Planning agents that generate long chain-of-thought reasoning before every tool call
Sampling and retention guidelines:
Infrastructure tradeoffs:
Hot storage (fast query, high cost) is appropriate for recent traces you're actively debugging. Cold storage (slow query, low cost) works for compliance archives and regression test datasets. Most teams run a 7-day hot window and move older traces to cold storage automatically. Indexing every field in every trace is expensive; index trace_id, eval_score, error, and prompt_version at minimum, and leave verbose fields like tool_args in cold storage.
Pro Tip: Set a per-run token budget in your agent framework before you go to production. A hard cap that returns a graceful fallback is cheaper and safer than an unlimited run that hits the context cliff and retries three times.
How Mindpod approaches agent monitoring rollout
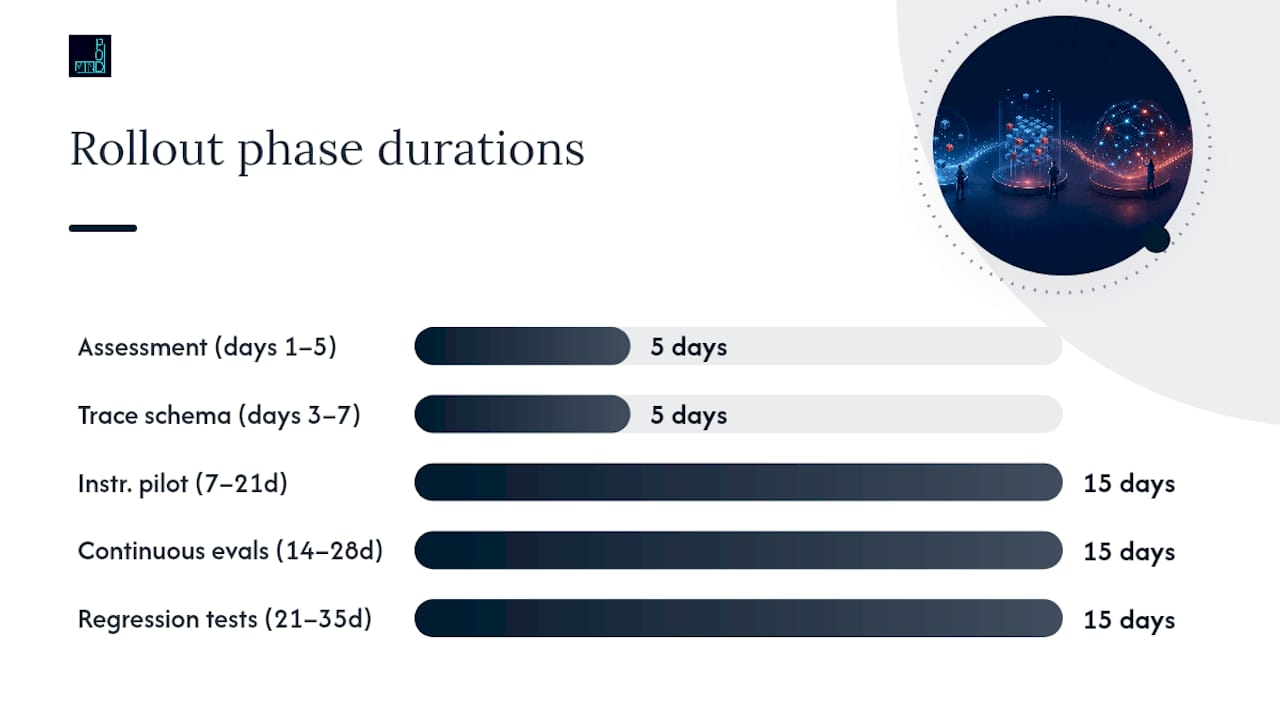
Mindpod Technologies treats monitoring as a first-class deliverable in every agentic AI engagement, not an afterthought. The rollout follows a reproducible sequence that SMB engineering teams can execute in four to six weeks.
Rollout checklist:
- Assessment (days 1–5): Audit existing agent code for instrumentation gaps; map all LLM calls, tool calls, and retrieval operations; identify PII exposure risks in current logging
- Minimal viable trace schema (days 3–7): Define the span fields from the schema above; agree on prompt versioning convention; set retention and redaction rules
- Instrumentation pilot (days 7–21): Instrument one agent or workflow end-to-end using OpenTelemetry semantic conventions; validate trace completeness against the schema; confirm cost accounting is accurate
- Continuous evals (days 14–28): Deploy at least two automated evaluators (one LLM-as-judge for quality, one code-based check for objective criteria); run on sampled production traffic; establish baseline scores
- Regression tests (days 21–35): Build a labeled eval dataset from the first two weeks of production traces; run regression tests on every prompt or model change before deployment
- Governance and RBAC (days 28–42): Configure role-based access to trace data; set up audit logs; define data retention and deletion policies aligned with your compliance requirements
- SLA and RTO definitions (days 35–42): Translate eval score thresholds and latency targets into formal SLAs; define rollback triggers and RTO for agent failures
Typical SMB engagement timeline and deliverables:
| Phase | Duration | Key deliverables |
|---|---|---|
| Discovery and assessment | Week 1 | Gap analysis, PII risk map, instrumentation scope |
| Instrumentation pilot | Weeks 2–3 | Trace schema JSON, OTel configuration, cost baseline |
| Continuous evals | Weeks 3–4 | Eval rubrics, baseline scores, alert definitions |
| Regression and governance | Weeks 4–6 | Regression test dataset, RBAC config, retention policy |
| Ongoing operations | Monthly | Drift reports, cost trend analysis, eval score reviews |
Sample artifacts every team should produce:
- Trace schema JSON: the field definitions above, serialized as a JSON Schema file your engineering team can validate against
- Eval rubric examples: a rubric for LLM-as-judge scoring (criteria, scale, example outputs at each score level) and a code-based check for at least one objective criterion (e.g., does the response contain a valid date format?)
- Alert definitions: mapped to business outcomes (eval score below 0.7 on customer-facing agent → page on-call; cost per run exceeds $0.50 → Slack alert to product team)
PwC's AI agent survey identifies governance, cost control, and explainability as the top organizational concerns when deploying autonomous agents at scale. The checklist above addresses all three directly, which is why Mindpod builds it into every engagement from day one rather than treating it as a compliance checkbox.
OpenTelemetry's Generative AI semantic conventions underpin the instrumentation pilot specifically to avoid vendor lock-in as the agent stack evolves.
What teams consistently get wrong about agent observability
The most common mistake is treating agent monitoring as a logging problem. Teams add verbose logging to every function, generate gigabytes of unstructured text, and then discover they can't answer the one question that matters: "Why did this agent give that answer?" Logs tell you what happened. Structured traces with eval scores tell you whether it was correct.
The second mistake is waiting to instrument until something goes wrong in production. By then, you have no baseline. You don't know what "normal" looks like for your agent's token spend, eval scores, or run depth. The first two weeks of production are your most valuable data collection window, and most teams waste them.
A subtler trap: trying to evaluate everything with LLM-as-judge. LLM judges are good at nuanced quality assessments — tone, coherence, helpfulness. They're slow and expensive for objective checks. If you need to verify that an agent returned a valid JSON object or cited a document that actually exists in your knowledge base, write a code-based check. It runs in milliseconds and costs nothing. Reserve LLM-as-judge for the quality dimensions that genuinely require judgment.
For SMBs specifically: don't let the perfect be the enemy of the shipped. A minimal trace schema, one automated evaluator, and a 14-day retention window is a working observability stack. You can add eval automation, regression tests, and governance controls incrementally. What you can't do is add them retroactively to a production agent that's already drifted and you have no baseline to compare against.
Hugging Face's agent observability unit recommends combining LLM-as-judge with code-based checks and running online evals on sampled production traffic — that combination covers both quality and correctness without breaking the bank on inference costs.
The governance angle is real and often underestimated. PwC's survey data puts governance and explainability at the top of enterprise concerns for agentic deployments. For SMBs, that translates to a practical question: if a customer asks why your agent gave a specific answer, can you show them the trace? If not, you have an explainability gap that will eventually become a liability.
Mindpodtech's assessment offer for teams ready to instrument
Mindpodtech's free technology assessment is the fastest way to find out where your agent stack is blind. In a single session, the advisory team maps your existing instrumentation, identifies the highest-risk gaps (usually PII exposure in logs, missing prompt versioning, and no eval baseline), and produces a prioritized plain-language plan you own.
The first engagement delivers a working trace schema, an OpenTelemetry-based instrumentation configuration, and at least two automated evaluators tied to your actual business SLAs — not generic rubrics. For teams already running agents in production, Mindpodtech can also run a two-week instrumentation pilot that produces a cost baseline, an eval score baseline, and a regression test dataset before any changes are made to the agent code itself.
For SMBs that need enterprise-grade AI agent monitoring without a dedicated observability team, that's the practical path: a fixed-scope engagement, a plan you can hand to your engineers, and ongoing fractional advisory to keep the eval loop running as your agent stack grows. Start with the free assessment to get a prioritized gap analysis within a week.
Sources
These are the primary references behind this guide. Each covers a distinct part of the implementation picture.
- Why observability is essential for AI agents | IBM
- AI Agent Observability: Tracing, Testing, and Improving Agents · LangChain
- AI Agent Observability: Tracing, Testing, and Improving Agents · Hugging Face
- AI agent survey — PwC
FAQ
How do you monitor AI agents in production?
Instrument every agent run with distributed tracing that captures LLM calls, tool calls, retrieval operations, and token usage per span. Then run automated evaluators on sampled production traces to measure quality, detect hallucinations, and catch drift before it compounds.
How does agent observability differ from traditional monitoring?
Traditional monitoring reports uptime and error rates. Agent observability instruments the decision-making layer — recording prompt versions, tool selections, retrieval context, and reasoning steps — so you can explain why an agent produced a specific output, not just that it failed.
What are the most dangerous silent failure modes in multi-agent systems?
Silent loops and subagent explosions are the costliest: individual spans look healthy while the agent burns through token budget without making progress. Detecting them requires tracking run depth and total tokens per trace as distributions, not just monitoring individual span errors.
What is the fastest way to start AI agent monitoring?
Enable end-to-end tracing on one agent workflow, adopt OpenTelemetry semantic conventions for Generative AI to keep traces portable, and deploy one automated evaluator within the first two weeks. That baseline gives you enough signal to catch regressions before they reach users.
How does Mindpodtech help with agent monitoring?
Mindpodtech's free technology assessment maps your instrumentation gaps and produces a prioritized plan within one week. The first engagement delivers a working trace schema, an OpenTelemetry configuration, and automated evaluators tied to your business SLAs.